Results, skill evolution, and interpretation
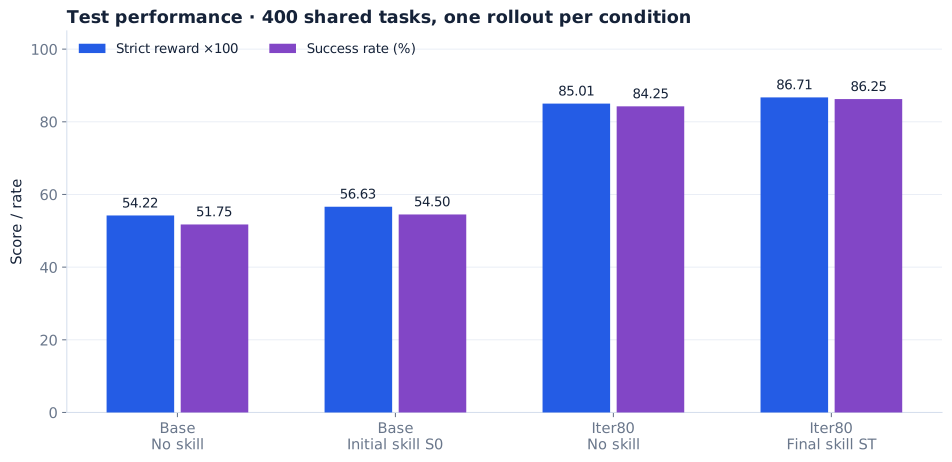
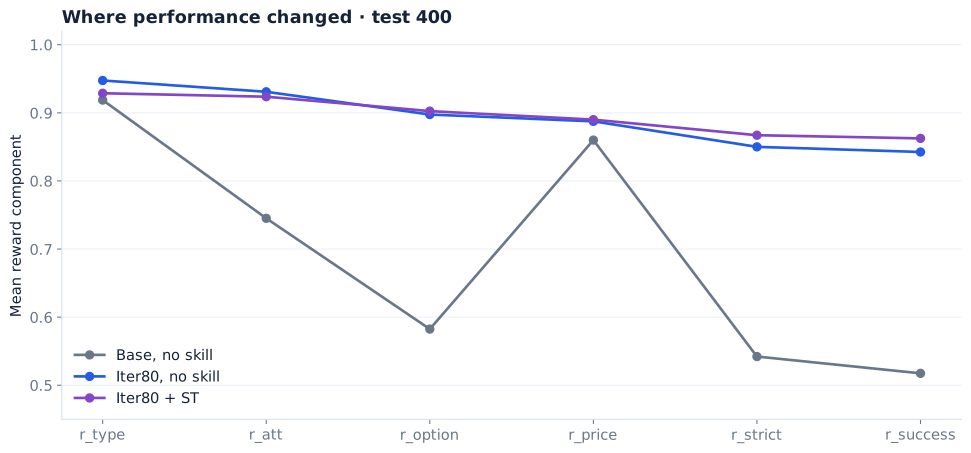
The strongest result is the performance of the trained policy without external skills. This separates final model capability from the additional inference-time effect of the selected skill, while leaving the contribution of individual training mechanisms unresolved.
Four paired test conditions
| Condition | Strict reward | Success | Mean model steps | Coverage |
|---|---|---|---|---|
| Base, no skill | 0.5422 | 51.75% | 6.2125 | 400/400 |
| Base + S₀ | 0.5663 | 54.50% | 6.6125 | 400/400 |
| Iter80, no skill | 0.8501 | 84.25% | 5.7525 | 400/400 |
| Iter80 + Sₜ | 0.8671 | 86.25% | 6.0100 | 400/400 |
| Paired success difference | Percentage points | 95% interval |
|---|---|---|
| Iter80 free − Base free | +32.50 | [+27.50, +37.50] |
| Base + S₀ − Base free | +2.75 | [−1.50, +7.25] |
| Iter80 + Sₜ − Iter80 free | +2.00 | [−0.50, +4.75] |
Intervals are task-paired percentile bootstrap estimates with 10,000 resamples. They describe test-task uncertainty conditional on this training run, not variability across training seeds. Both skill-only intervals span zero. No claim of a statistically established final-skill gain is made.
Bare Base → Iter80 changes 139 tasks from failure to success and nine from success to failure; 198 succeed in both conditions and 54 fail in both. Adding Sₜ to Iter80 fixes 19 tasks and regresses 11, net eight successes. Aggregate improvement does not mean every task improves.
Validation and the evolving bank
| Checkpoint | Bare strict | Random-mask strict | Bare success | Selected chunks | Candidates |
|---|---|---|---|---|---|
| Iter20 | 0.765952 | 0.791661 | 74.75% | 7 | 6 |
| Iter40 | 0.813119 | 0.840690 | 80.00% | 5 | 6 |
| Iter60 | 0.860119 | 0.879774 | 84.75% | 8 | 6 |
| Iter80 | 0.869417 | 0.876024 | 86.00% | 8 | 4 |
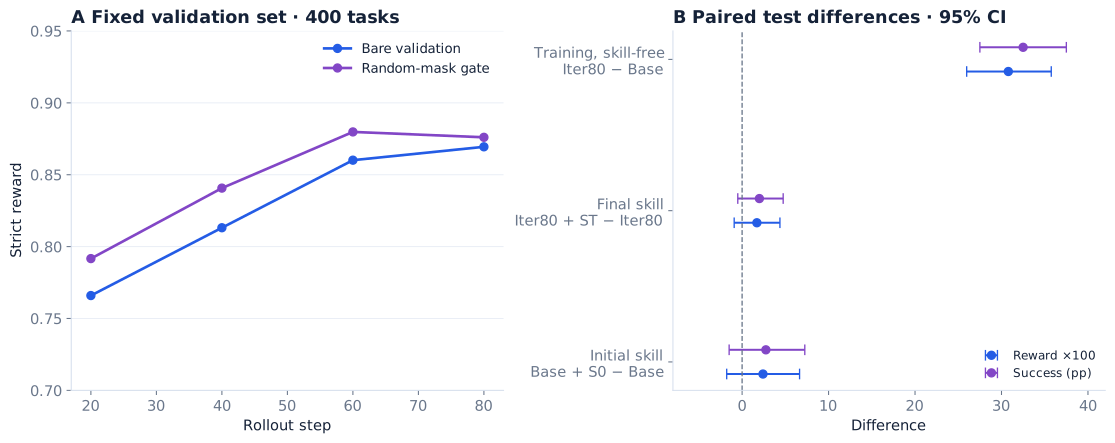
The randomized gate evaluates a pool of current and candidate versions, not the selected full bank. Its mean cannot substitute for final full-skill evaluation. The bank's initial ten chunks shrink to seven and five, then grow to eight. This reflects both retirement and new/revised procedures.
| Round | All-wrong groups | Failed retry / analyzed cards | Eligible cards | Candidates |
|---|---|---|---|---|
| R0 | 104 | 87 | 61 | 6 |
| R1 | 57 | 56 | 22 | 6 |
| R2 | 54 | 53 | 20 | 6 |
| R3 | 39 | 39 | 11 | 4 |
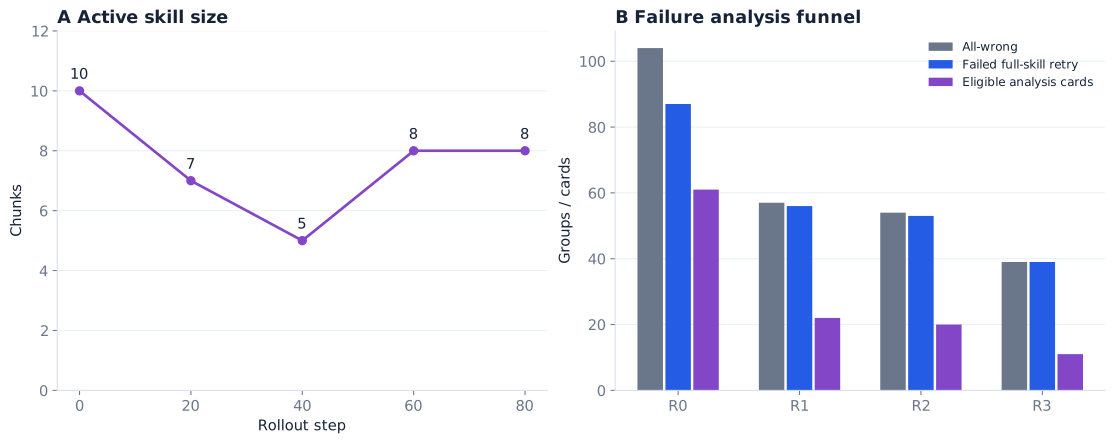
Subtracting analyzed cards from all-wrong groups does not yield the number solved by full skills: technical retry errors also occur. Recorded internalization-deficit counts are 9, 1, 1, and 0. Technical faults, all-wrong policy groups, remaining diagnostic failures, and eligible skill proposals are distinct stages.
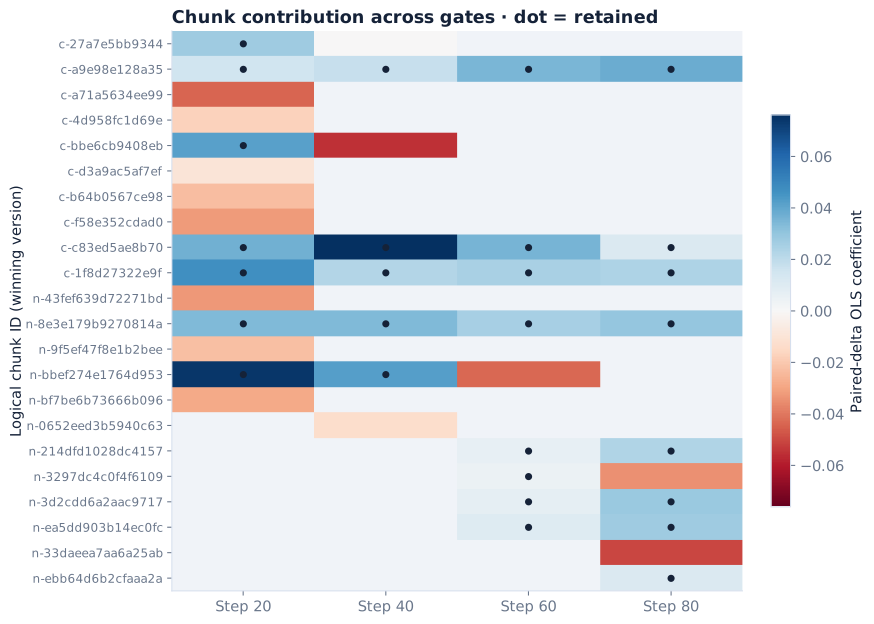
The heatmap aligns logical chunk identities; a dot denotes a retained winner, and an empty cell means not evaluated in that gate. Rewrites retain logical identity. Losing versions remain in the downloadable coefficient table. The home page's skill explorer includes the verbatim Chinese text of every selected bank.
Additional guidance also has costs
Not every component improves when Sₜ is added. Iter80 + Sₜ uses 2,404 total model steps with 276 protocol errors, compared with 2,301 steps and 144 errors for Iter80 free. Error counts divided by total steps are 11.48% and 6.26%; these differ from averaging each task's error rate. API generation averages 191.02 versus 172.93 tokens per turn. More prompt tokens and measured latency also accompany the full skill, but latency is service- and hardware-dependent.
Ranking appendix and missing controls
An additional Base-model comparison at fixed k=4 gives top4 success 51.75%, bottom4 55.00%, and one random4 draw 54.25%. Only random seed 20260907 was completed; four planned random draws were not run. These factors came from a separate local Base gate, not the historical recovered S₀ coefficients. This does not establish held-out ranking validity or a reverse-ranking advantage.
The experiment has no plain-GRPO, fixed-S₀, no-mask, no-online-gate, q-sweep, or multiple-training-seed controls. It demonstrates substantial improvement over the initial model under this training system. It does not establish that co-evolution outperforms ordinary RL, or identify which component causes the observed gains. Repeated validation use, noisy main-effect coefficients, possible chunk interactions, and historical S₀ provenance remain material limitations.
Continue with behavior changes, optimization diagnostics, or the full original experiment report.