How shopping behavior changes during training
Reward alone cannot distinguish shorter reasoning, better tool use, more persistent search, or a different mix of solved tasks. We extracted 20,480 training episodes / 110,997 model turns, plus 3,600 completed evaluation episodes from nine conditions. The analysis is retrospective and introduces no new model sampling.
Measurement dictionary
| Metric | Definition |
|---|---|
| Model steps | Saved model turns, including unsuccessful protocol repairs |
| Actions / valid actions | Submitted actions / actions explicitly accepted by environment feedback |
| Tokens per turn | First divide each complete episode's generated tokens by model turns, then average episodes |
| Pooled tokens per turn | Total tokens divided by total turns; longer episodes have more weight |
| Training tokens | Re-encoded saved raw_output, including reasoning and serialized tool-call markup; not original sampled IDs |
| Evaluation tokens | Recorded API completion_tokens, including reasoning; no input tokens |
| Searches / unique queries | Valid executed search calls / whitespace-normalized, case-folded distinct queries |
| Product opens | Valid search-result → product-detail transitions |
| Unique products / revisits | Distinct opened product IDs / repeat opens of an already opened ID |
| Option selections / changes | Valid option clicks / switching an already selected axis to a different value |
| Backtracking / pagination | Return from detail or restart search / navigation between result pages |
| Protocol errors / invalid actions | Failed model-output parsing / explicit invalid environment feedback |
Selecting a color or size refreshes the same product page; it does not increment product opens. Products merely visible in search results are not counted as visited product pages. Tokens are available for every scored training episode and completed evaluation episode; technical episodes remain separately labeled. Failed-attempt request cost is not reconstructed here.
Successful paths stay short; remaining failures have longer tails
| Round | Outcome | n | Turns | Tokens/turn | Searches | Unique products |
|---|---|---|---|---|---|---|
| R0 | success | 3234 | 4.54 | 259.01 | 1.07 | 1.05 |
| R0 | failure | 1827 | 6.76 | 309.66 | 1.41 | 1.25 |
| R1 | success | 4191 | 4.58 | 250.32 | 1.07 | 1.05 |
| R1 | failure | 929 | 9.72 | 276.21 | 2.03 | 1.41 |
| R2 | success | 4281 | 4.83 | 184.66 | 1.13 | 1.04 |
| R2 | failure | 839 | 10.28 | 217.82 | 2.28 | 1.44 |
| R3 | success | 4471 | 4.56 | 209.91 | 1.07 | 1.04 |
| R3 | failure | 649 | 8.97 | 299.44 | 2.07 | 1.30 |
Successful training episodes remain around 4.5–4.8 turns, with a median of four in every round. Failure means rise from 6.76 to 8.97 turns between R0 and R3, peaking at 10.28 in R2; their 90th percentiles are 13, 22, 22, and 18.2. The shrinking failure population is increasingly selective. This is descriptive evidence about residual failures, not proof that training makes a fixed failing task harder.
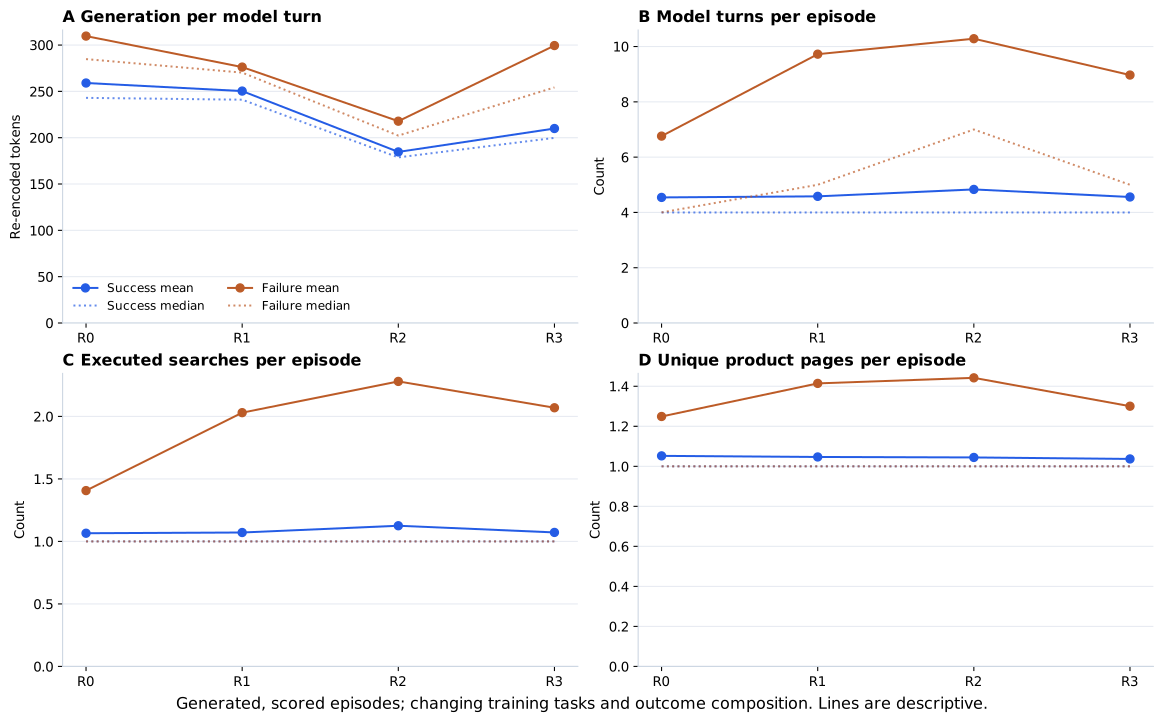
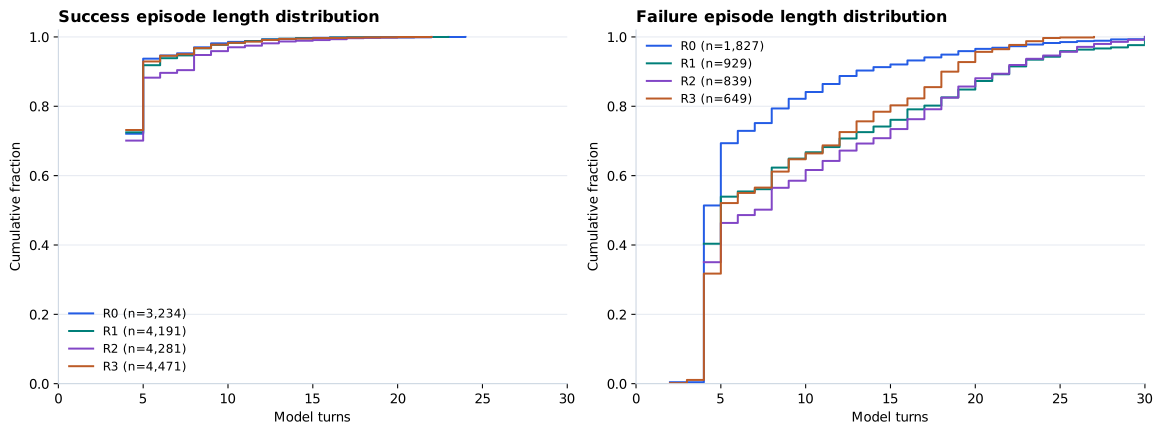
R0 includes 59 technically unscored episodes. They are excluded from success/failure means, not converted into reward-zero policy failures. The compared R0 and R3 generated-task sets have no overlapping task IDs, so a within-task training-round contrast cannot be estimated. We use fixed validation tasks for the longitudinal comparison below.
Less generation is clearer than fewer interactions
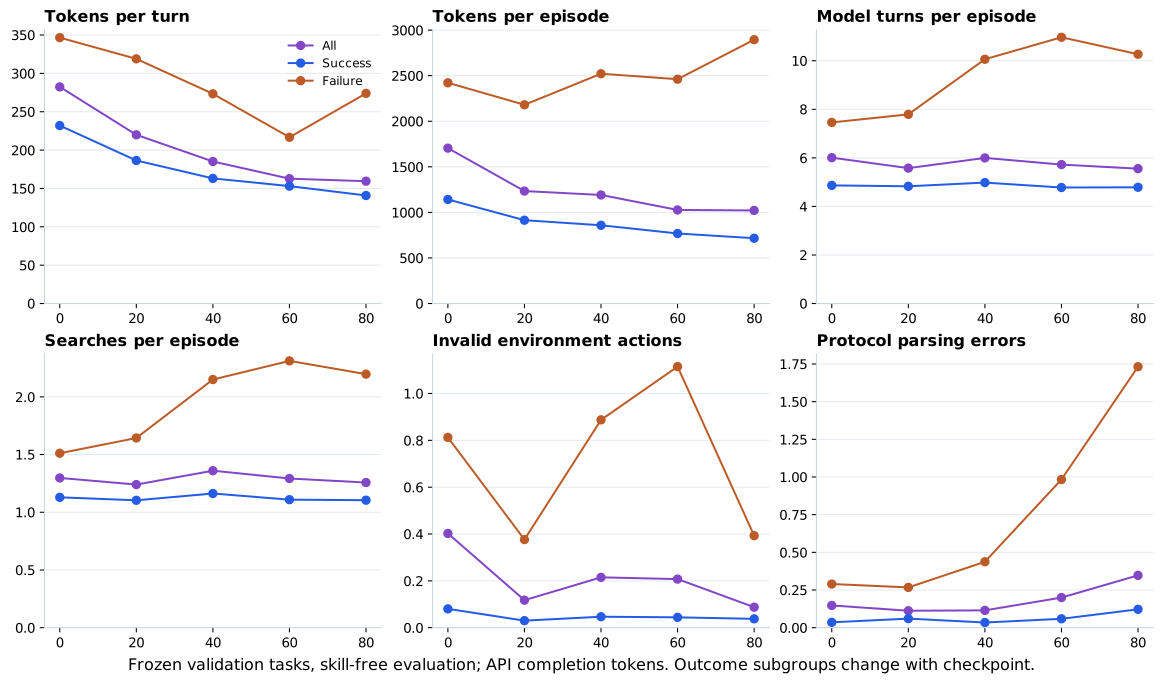
On the same 400 bare-validation tasks, Base → Iter80 reduces average tokens per turn from 282.39 to 159.46 (−43.5%) and tokens per episode from 1,704.93 to 1,021.50 (−40.1%). First-turn generation falls from 216.61 to 129.37 tokens, before the agent has executed its first search. This suggests a changed generation style as well as any difference in later navigation.
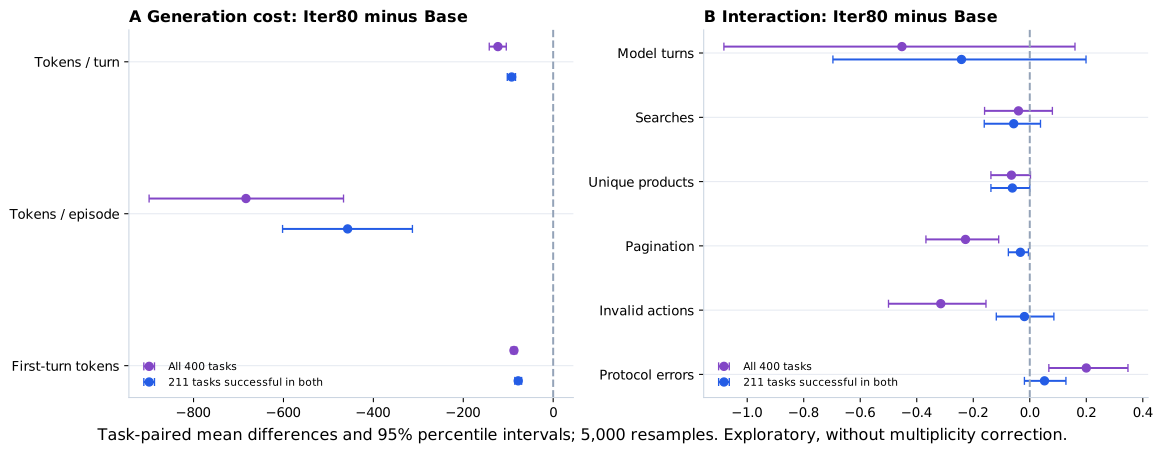
Average model steps fall from 6.01 to 5.56, but the paired interval spans zero. Search counts (1.298 → 1.258) and unique opened products (1.160 → 1.095) also lack clear nonzero paired differences. We therefore do not describe the overall change as conclusively “fewer searches” or “fewer steps.”
| Metric | Base | Iter80 | Difference | 95% interval |
|---|---|---|---|---|
| Model turns | 6.008 | 5.555 | -0.453 | [-1.083, +0.160] |
| Tokens / turn | 282.388 | 159.455 | -122.933 | [-142.190, -104.312] |
| Tokens / episode | 1704.928 | 1021.500 | -683.428 | [-898.903, -466.375] |
| Searches | 1.298 | 1.258 | -0.040 | [-0.160, +0.080] |
| Unique products | 1.160 | 1.095 | -0.065 | [-0.138, +0.003] |
| Pagination | 0.245 | 0.018 | -0.228 | [-0.367, -0.110] |
| Invalid actions | 0.403 | 0.087 | -0.315 | [-0.500, -0.155] |
| Protocol errors | 0.147 | 0.347 | +0.200 | [+0.068, +0.347] |
The 211 tasks successful at both Base and Iter80 provide a useful additional slice: generation falls by 92.32 tokens per turn, 95% interval [−102.08, −83.79], while step reduction remains uncertain. This slice is selected using both outcomes and is descriptive, not an unbiased causal subgroup. All intervals use 5,000 task-paired percentile bootstrap resamples and quantify task variation conditional on this run. The exploratory metric family has no multiple-comparison adjustment.
Better environment validity, more parsing trouble
Invalid environment actions fall from 0.4025 to 0.0875 per fixed validation episode; protocol parsing errors rise from 0.1475 to 0.3475. These are distinct failure surfaces. The former asks whether a submitted action is valid in the environment; the latter asks whether a model response can be interpreted as the required tool call. A policy can improve one while worsening the other.
The first opened product's recorded result rank moves from 4.96 to 1.30 on the 399 tasks with an observed first open in both conditions. Pagination falls from 0.245 to 0.0175 per task. Together these show a stronger tendency toward early-ranked results. They do not by themselves establish better query semantics or prove that fewer comparisons are desirable; relevance and task outcomes must be considered jointly.
Where generation changes
We classify each turn by the page state before its action: search home, search results, product detail, or protocol repair. This separates initial planning, choosing a result, checking variants, and repairing format. Turn-weighted means and 90th percentiles reveal long outputs that an episode mean can hide.
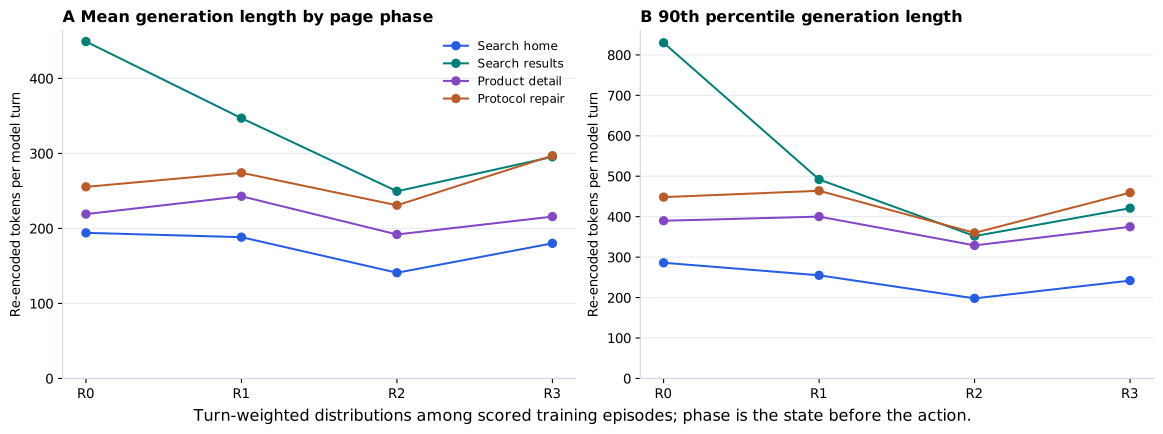
Training generation is not monotonic: episode-average tokens per turn are 277.30, 255.02, 190.09, and 221.26 across rounds. Skill content and sampled tasks change at round boundaries. These curves cannot isolate a parameter-only effect or directly share an absolute token scale with the API-based evaluation series.
Trace examples with explicit selection rules
The examples below are selected after analysis to illustrate mechanisms. They are not a random sample or evidence of prevalence. We include both improvements and a regression. Each path uses action categories rather than full private task context; ties are resolved by lower task ID.
Task 1828 · Both successful: largest step reduction
Base · 25 turns · 6,174 tokens · success=1
Iter80 · 4 turns · 740 tokens · success=1
Task 3538 · Failure → success: largest token reduction
Base · 30 turns · 13,465 tokens · success=0
Iter80 · 4 turns · 1,045 tokens · success=1
Task 4359 · Success → failure: longest final trajectory
Base · 4 turns · 959 tokens · success=1
Iter80 · 30 turns · 6,084 tokens · success=0
Download and extend
The episode table, turn table, evaluation episodes, and evaluation turns support additional slicing. The summary JSON includes all 80 steps, means/medians/p90, success/failure distributions, skill-free/assisted round summaries, phase statistics, and pairing metadata.
Assistance comparisons within training are observational: q, task assignment, selection, and current skill content affect them. They are not a randomized estimate of the effect of adding the final skill. The test results and W&B diagnostics complement these behavior measurements.