W&B: optimization and systems diagnostics
We read complete, unsampled scan_history() records from the four finished W&B runs. Each run has 100 logging events, including 20 rollout batches and 40 optimizer updates. The combined series contains 80 rollout steps and 160 optimizer updates. Across 3,118 overlapping numeric fields, W&B and the local log extraction agree exactly.
| Round | Run | State | History events |
|---|---|---|---|
| R0 | 8ov14yyc | finished | 100 |
| R1 | chjizc8u | finished | 100 |
| R2 | 7vhbv5j0 | finished | 100 |
| R3 | y4xk6byf | finished | 100 |
The horizontal axis matters
W&B _step is a logging-event counter, not a training iteration. The explicit rollout/step spans 1–80, while train/step spans 2–161 in these runs. We display update number as train/step − 1, and associate it with floor(train/step / 2). This mapping is checked against each run's round and expected coverage. No interpolation fills missing metric records.
Policy diagnostics
| Round | Entropy | Clip fraction | Gradient norm | Actor tokens/s |
|---|---|---|---|---|
| R0 | 0.18025 | 0.00123 | 2.18 | 13538.13 |
| R1 | 0.15557 | 0.00058 | 2.16 | 13502.78 |
| R2 | 0.14212 | 0.00056 | 1.38 | 13468.47 |
| R3 | 0.13258 | 0.00038 | 1.14 | 13527.11 |
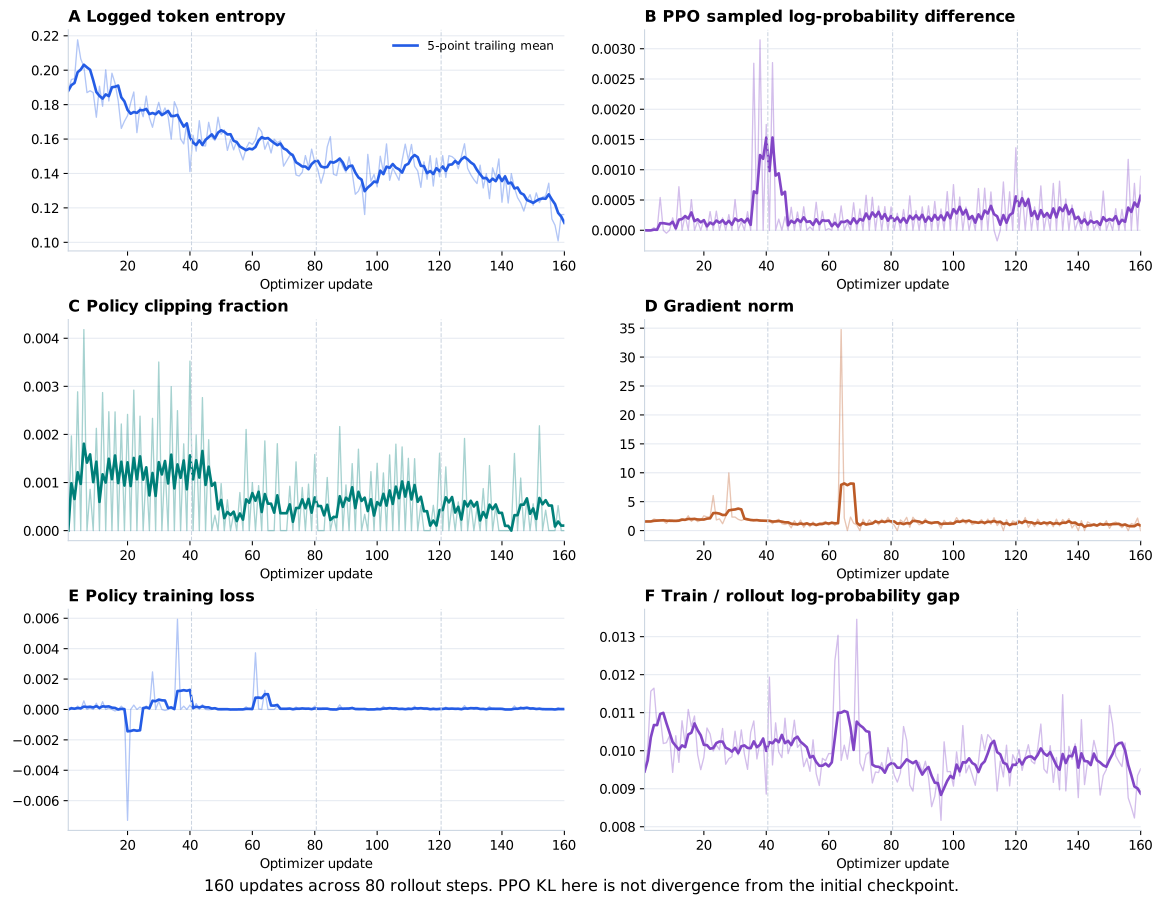
The logged entropy mean declines from 0.1802 to 0.1326 across rounds, roughly 26%. In the local slime loss implementation, entropy_loss is the entropy statistic reduced over training samples; it is not itself the full objective. Lower entropy indicates a more concentrated token distribution on this training data. It does not prove improved calibration, broader task competence, or reduced semantic diversity.
train/ppo_kl is a sampled old-minus-current log-probability difference in the PPO loss path. It is not divergence from the initial model. Its near-zero values in the first update of a rollout batch are expected when old and current policy coincide; the second update follows a weight change. The full series and clipping fraction should be read with that two-update structure in mind.
The round-average clipping fraction falls from 0.00123 to 0.00038. Mean gradient norm falls from 2.18 to 1.14. Eight updates have a recorded zero gradient norm: display updates 66, 70, 82, 116, 140, 142, 156, and 160. These are observable diagnostics, not sufficient evidence of a training bug or complete convergence. Establishing their cause would require the exact admitted minibatch advantages and optimizer state.
Mean absolute train/rollout log-probability difference stays near 0.01. This checks a different issue from reward: numerical consistency between generation and training computations. Small loss values are also not direct measures of task quality under group-relative reward normalization.
Response length and performance
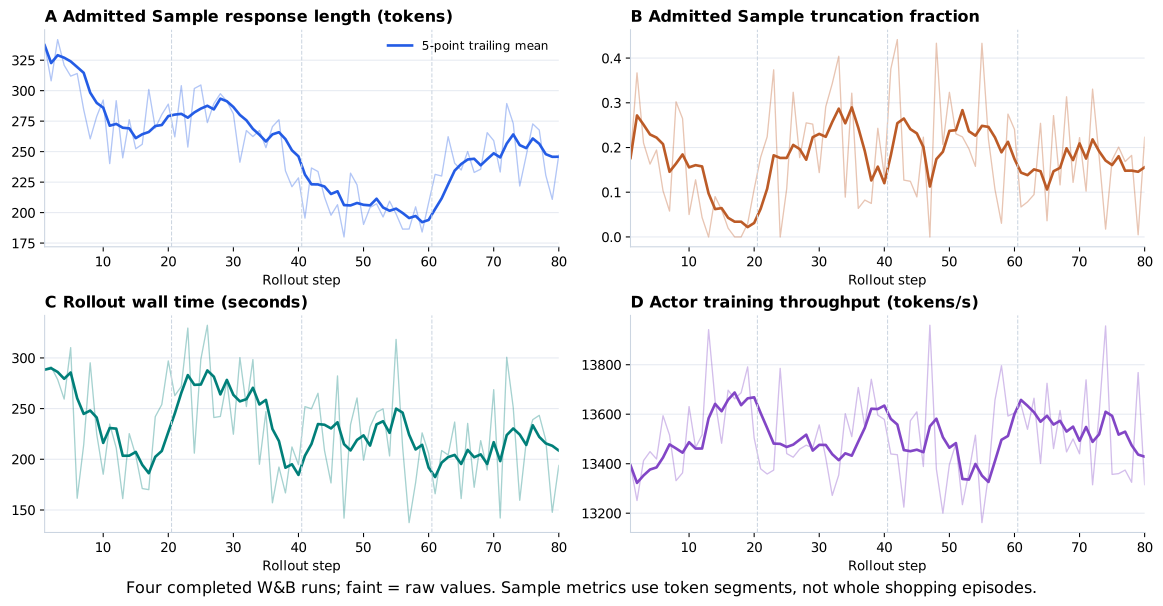
W&B rollout/response_len/mean averages effective response length of admitted slime Samples. Dynamic tool-schema changes can segment an episode, so this metric is not the average total generation per shopping episode. rollout/truncated_ratio is likewise a Sample-status fraction. The separate behavior analysis measures model turns and complete episodes directly.
Mean admitted Sample response lengths are approximately 288, 269, 205, and 247 tokens across rounds. Their shape resembles the retrospective generation curve, but their population and weighting differ. Sample truncation fractions are 11.8%, 20.4%, 22.3%, and 15.8%; they must not be described as episode failure rates.
Actor training throughput averages roughly 13.5k tokens/s in all four rounds. Rollout wall time averages 234, 245, 224, and 209 seconds per batch. Runtime figures reflect this machine, its concurrency, context distribution, and service scheduling. Summing one timing series does not include all validation, skill-analysis, startup, and idle time in the project.
Reproducible source data
Download the rollout-level CSV, optimizer-update CSV, combined summary, or source manifest. The archived per-run JSON contains numeric history only. Credentials, run configs, console logs, and media are not exported.
The fetch script uses the W&B public API's complete-history iterator. Aggregation and plotting work offline from the frozen exports. The source semantics were checked against the local slime loss.py, model.py, and rollout metrics implementation; these are framework diagnostics rather than new shopping reward definitions.